אלגוריתם קירוב אופטימיזציה קוונטי
הערכת שימוש: 22 דקות על מעבד Heron r3 (הערה: זוהי הערכה בלבד. זמן הריצה שלך עשוי להשתנות.)
תוצרי למידה
-
כיצד למפות בעיית אופטימיזציה קומבינטורית קלאסית (max-cut) להמילטוניאן קוונטי
-
כיצד לממש ולהריץ את אלגוריתם קירוב האופטימיזציה הקוונטי (QAOA) באמצעות סשנים של IBM Quantum Compute Service
-
כיצד להרחיב זרימת עבודה של QAOA מדוגמת סימולטור קטנה להרצה בקנה מידה שימושי על חומרה
דרישות מקדימות
-
QAOA לעומק — לטיפול מקיף באלגוריתם QAOA וביישומו בקנה מידה שימושי
רקע
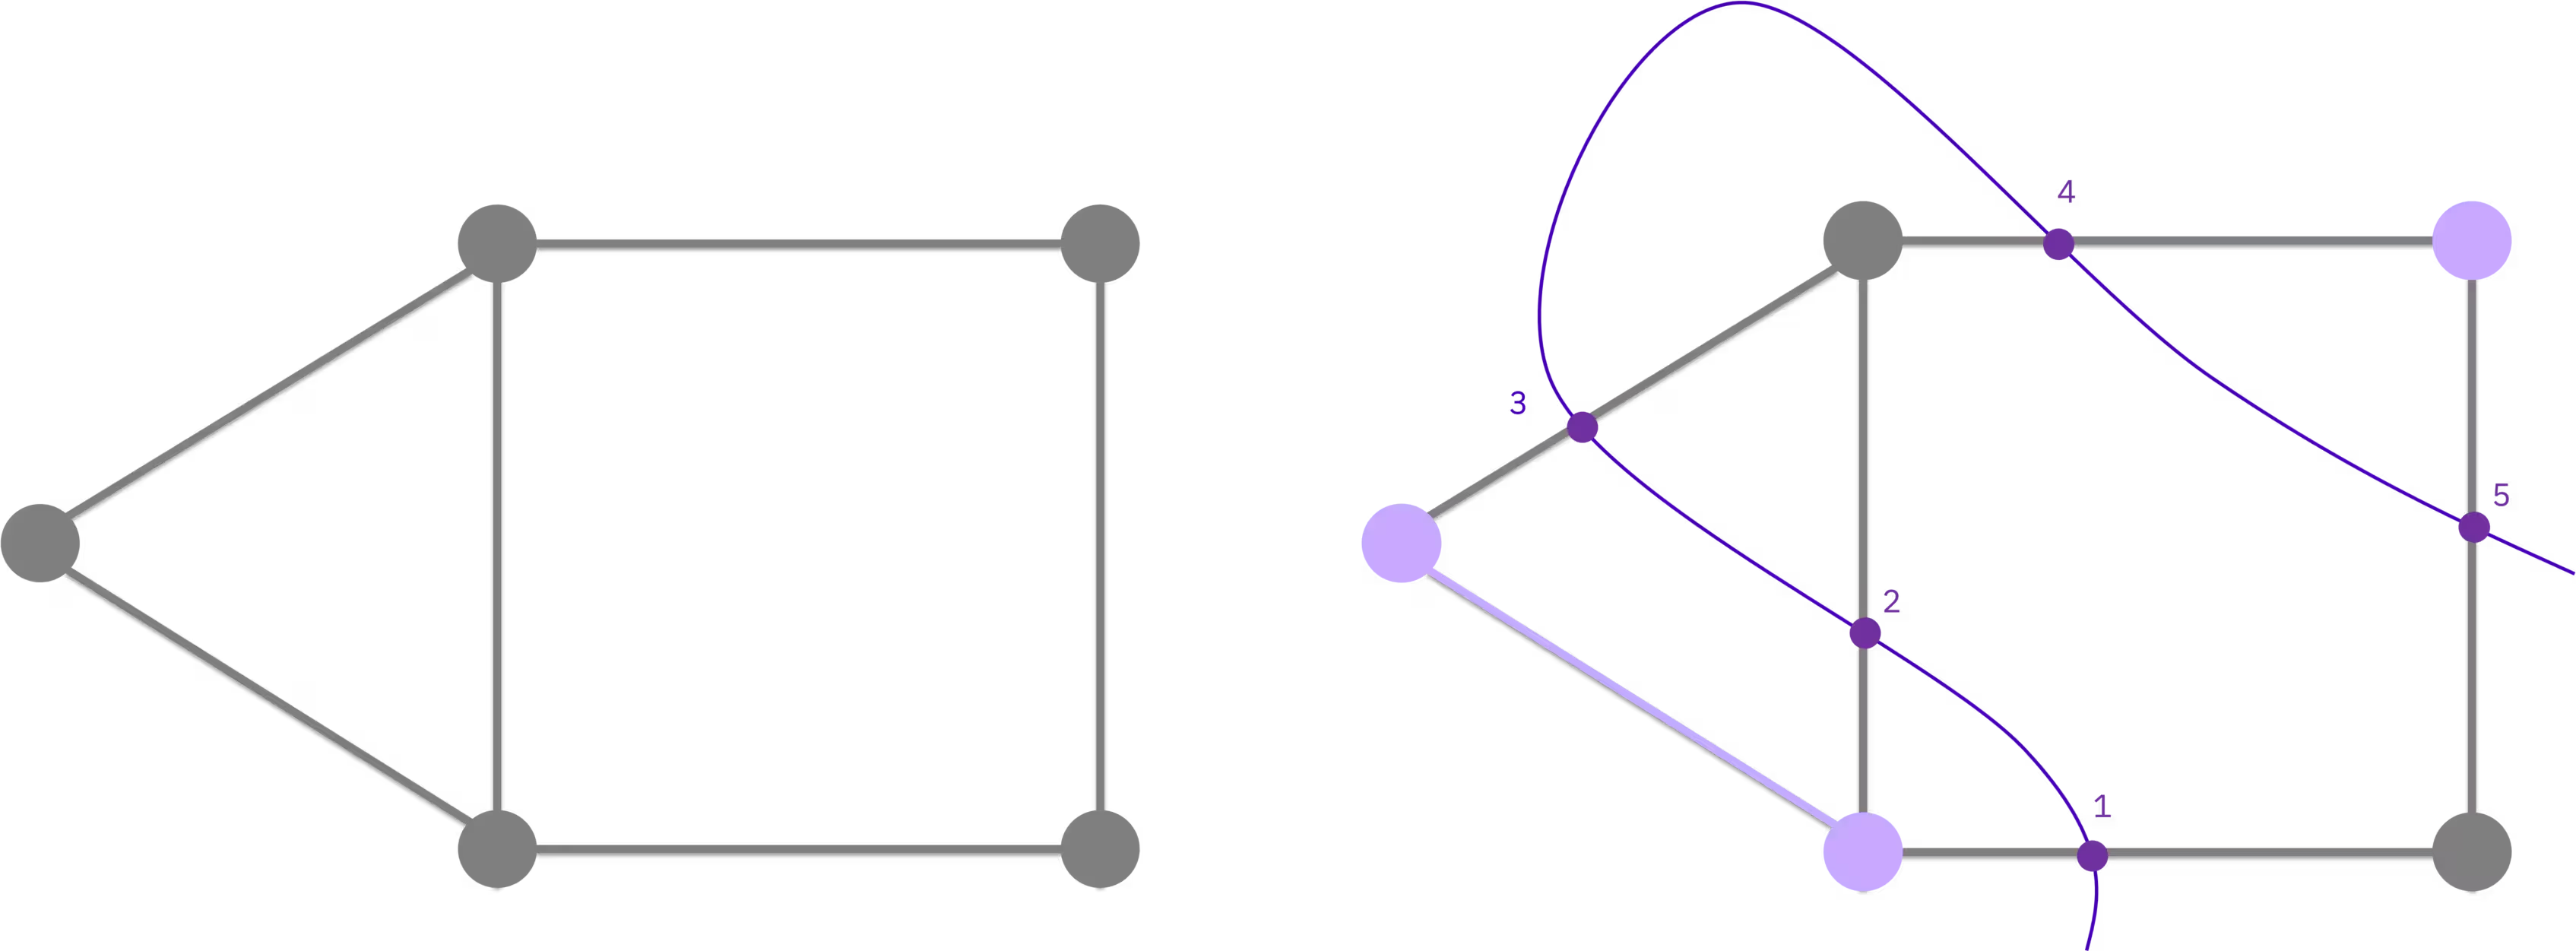
אלגוריתם קירוב האופטימיזציה הקוונטי (QAOA) הוא שיטה איטרטיבית היברידית קוונטית-קלאסית לפתרון בעיות אופטימיזציה קומבינטורית. במדריך הזה תשתמש ב-QAOA כדי לפתור את בעיית החיתוך המקסימלי (max-cut) — בעיית אופטימיזציה מסוג NP-hard עם יישומים בניתוח אשכולות, מדעי הרשת ופיזיקה סטטיסטית. בהינתן גרף של קודקודים המחוברים בקשתות, המטרה היא לחלק את הקודקודים לשתי קבוצות כך שמספר הקשתות החוצות את החלוקה יהיה מקסימלי.
אופטימיזציה קומבינטורית מופיעה גם באתגרי קיימות, כמו תכנון מסלולי משלוח כדי להפחית שימוש בדלק והקצאת משאבים כדי לצמצם פסולת חומרים. הדוגמה של max-cut מציגה את התהליך של ניסוח מטרה כהמילטוניאן עלות וחקירת פתרונות מועמדים עם QAOA. יישום גישה זו על בעיית קיימות דורש מטרה ואילוצים המייצגים את היישום המיועד.
מאופטימיזציה קלאסית למעגלים קוונטיים
ניתן לבטא את max-cut כבעיית אופטימיזציה בינארית קלאסית. לכל קודקוד מוקצה משתנה בינארי המציין לאיזו קבוצה הוא שייך. המטרה היא למקסם את מספר הקשתות שבהן הקצוות נמצאים בקבוצות שונות:
באופן שקול, זוהי בעיית אופטימיזציה בינארית ריבועית ללא אילוצים (QUBO) מהצורה . באמצעות החלפת משתנים סטנדרטית (), ניתן לכתוב מחדש את ה-QUBO כהמילטוניאן עלות שמצב היסוד שלו מקודד את הפתרון האופטימלי. באופן כללי, להמילטוניאן הזה יש איברים ריבועיים וגם ליניאריים:
עבור בעיית max-cut הלא-משוקללת הנדונה כאן, המקדמים הליניאריים מתאפסים () ו- עבור כל קשת, מה שמותיר את הצורה הפשוטה יותר שתבנה בקוד בהמשך. הצורה הכללית יותר לעיל היא מה שתצטרך כדי להתאים את זרימת העבודה הזו לגרפים משוקללים או לבעיות אחרות שניתן לבטא כ-QUBO.
כיצד QAOA עובד
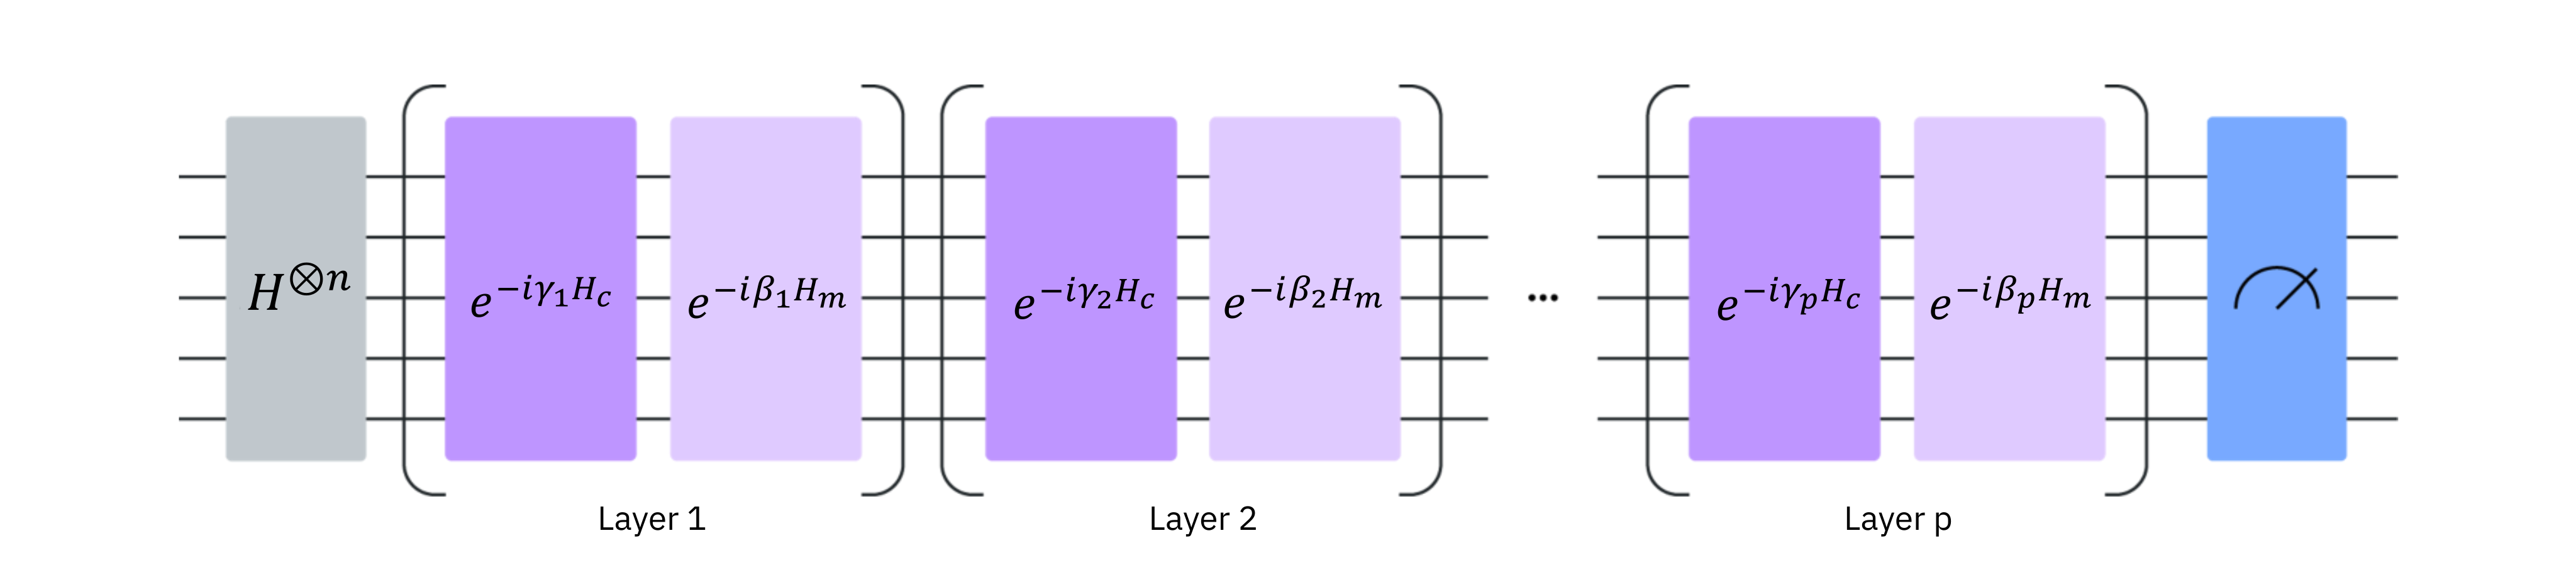
QAOA מכין פתרונות מועמדים על ידי החלת שכבות מתחלפות של שני אופרטורים על מצב סופרפוזיציה התחלתי : אופרטור העלות ואופרטור הערבוב (mixer) . הזוויות ו- עוברות אופטימיזציה בלולאת משוב קלאסית; המחשב הקוונטי מעריך את פונקציית העלות, ואופטימייזר קלאסי מעדכן את הפרמטרים עד להתכנסות. הלולאה האיטרטיבית הזו רצה בתוך session של Quantum Compute, השומר על ההתקן הקוונטי שמור לאורך האיטרציות לקבלת זמן השהיה נמוך יותר.
לטיפול מעמיק יותר בתאוריה של QAOA, כולל הגזירה המלאה מ-QUBO להמילטוניאן, ראה את מודול הקורס של QAOA.
במדריך הזה תפתור תחילה max-cut על גרף קטן בן חמישה קודקודים, ולאחר מכן תרחיב את אותה זרימת עבודה לבעיה בקנה מידה שימושי בת 100 קודקודים על חומרה אמיתית. הערה לגבי גישה לתוכנית: מדריך זה משתמש בסשנים של Quantum Compute, הזמינים רק בתוכנית Premium. אם אתה בתוכנית Open, אינך יכול להריץ את המדריך כפי שהוא כתוב; במקום זאת, תצטרך להחליף את Session ב-job mode (כלומר, להגיש כל איטרציה כ-job עצמאי במקום לעטוף את לולאת האופטימיזציה ב-with Session(...)). זרימת העבודה עדיין רצה, אך כל איטרציה סופגת את זמן ההמתנה המלא בתור במקום לעשות שימוש חוזר בהתקן שמור. ראה סקירה כללית של התוכניות הזמינות למידע נוסף.
דרישות
לפני תחילת מדריך זה, ודא שיש לך את הדברים הבאים מותקנים:
-
Qiskit SDK גרסה 2.0 ומעלה, עם תמיכה ב-ויזואליזציה
-
Qiskit Runtime גרסה 0.22 ומעלה (
pip install qiskit-ibm-runtime)
בנוסף, תזדקק לגישה לאינסטנס ב-IBM Quantum® Platform.
הגדרה
# Added by doQumentation — installs the packages this notebook needs if they are missing
import importlib.util

_needed = {"matplotlib": "matplotlib", "numpy": "numpy", "qiskit": "qiskit", "qiskit_ibm_runtime": "qiskit-ibm-runtime", "rustworkx": "rustworkx", "scipy": "scipy"}
_missing = [pip for module, pip in _needed.items()
            if importlib.util.find_spec(module) is None]
# One at a time, so a package that fails to install does not block the others
for _pip in _missing:
    %pip install -q {_pip}
if not _missing:
    print("\u2713 All required packages are installed")
import matplotlib.pyplot as plt
import rustworkx as rx
from rustworkx.visualization import mpl_draw as draw_graph
import numpy as np
from scipy.optimize import minimize
from collections import defaultdict
from typing import Sequence

from qiskit.quantum_info import SparsePauliOp
from qiskit.circuit.library import QAOAAnsatz
from qiskit.transpiler.preset_passmanagers import generate_preset_pass_manager

from qiskit_ibm_runtime import QiskitRuntimeService
from qiskit_ibm_runtime import Session, EstimatorV2 as Estimator
from qiskit_ibm_runtime import SamplerV2 as Sampler
דוגמה בקנה מידה קטן
החלק הזה עובר על כל שלב בזרימת העבודה של QAOA על מופע max-cut קטן בן חמישה קודקודים. למרות התווית "קנה מידה קטן", הדוגמה הזו עדיין רצה על חומרת IBM Quantum אמיתית — הקוד בוחר Backend עם 127 qubits או יותר ומריץ שם את ה-Circuit. אתחל את הבעיה שלך על ידי יצירת גרף עם קודקודים.
n_small = 5

graph = rx.PyGraph()
graph.add_nodes_from(np.arange(0, n_small, 1))
edge_list = [
    (0, 1, 1.0),
    (0, 2, 1.0),
    (0, 4, 1.0),
    (1, 2, 1.0),
    (2, 3, 1.0),
    (3, 4, 1.0),
]
graph.add_edges_from(edge_list)
draw_graph(graph, node_size=600, with_labels=True)

שלב 1: מיפוי קלטים קלאסיים לבעיה קוונטית
מפה את הגרף הקלאסי לCircuits ואופרטורים קוונטיים. כפי שתואר ברקע, עבור max-cut לא-משוקלל המילטוניאן העלות מצטמצם ל-, ו-QAOA משתמש ב-Circuit ansatz פרמטרי כדי להכין מצבי יסוד מועמדים של .
בניית המילטוניאן העלות
המר את קשתות הגרף לאיברי Pauli כדי לבנות את (ראה רקע לגזירה).
def build_max_cut_paulis(
    graph: rx.PyGraph,
) -> list[tuple[str, list[int], float]]:
    """Convert graph edges to a list of ZZ Pauli terms.

    The returned list is in the sparse format expected by
    ``SparsePauliOp.from_sparse_list``: each element is
    ``(pauli_string, qubit_indices, coefficient)``.
    """
    pauli_list = []
    for edge in list(graph.edge_list()):
        weight = graph.get_edge_data(edge[0], edge[1])
        pauli_list.append(("ZZ", [edge[0], edge[1]], weight))
    return pauli_list

max_cut_paulis = build_max_cut_paulis(graph)
cost_hamiltonian = SparsePauliOp.from_sparse_list(max_cut_paulis, n_small)
print("Cost Function Hamiltonian:", cost_hamiltonian)
Cost Function Hamiltonian: SparsePauliOp(['IIIZZ', 'IIZIZ', 'ZIIIZ', 'IIZZI', 'IZZII', 'ZZIII'],
              coeffs=[1.+0.j, 1.+0.j, 1.+0.j, 1.+0.j, 1.+0.j, 1.+0.j])
בניית מעגל ה-QAOA ansatz
השתמש ב-QAOAAnsatz כדי לבנות את ה-Circuit הפרמטרי של QAOA מתוך המילטוניאן העלות. כאן אנו משתמשים ב-reps=2 (שתי שכבות QAOA, ארבעה פרמטרים: ).
circuit = QAOAAnsatz(cost_operator=cost_hamiltonian, reps=2)
circuit.measure_all()

circuit.draw("mpl")

circuit.parameters
ParameterView([ParameterVectorElement(β[0]), ParameterVectorElement(β[1]), ParameterVectorElement(γ[0]), ParameterVectorElement(γ[1])])
שלב 2: אופטימיזציה של הבעיה לביצוע על חומרה קוונטית
בצע Transpile של ה-Circuit המופשט להוראות מקוריות לחומרה. השלב הזה מטפל במיפוי qubits, בפירוק שערים, בניתוב ובדיכוי שגיאות. ראה את תיעוד הטרנספילציה למידע נוסף.
service = QiskitRuntimeService()
backend = service.least_busy(
    operational=True, simulator=False, min_num_qubits=127
)
print(backend)

# Create pass manager for transpilation. Level 3 is the most aggressive
# preset: slower to transpile, but produces shorter circuits that are
# more robust to hardware noise.
pm = generate_preset_pass_manager(optimization_level=3, backend=backend)

candidate_circuit = pm.run(circuit)
candidate_circuit.draw("mpl", fold=False, idle_wires=False)
<IBMBackend('ibm_pittsburgh')>

שלב 3: ביצוע באמצעות פרימיטיבים של Qiskit
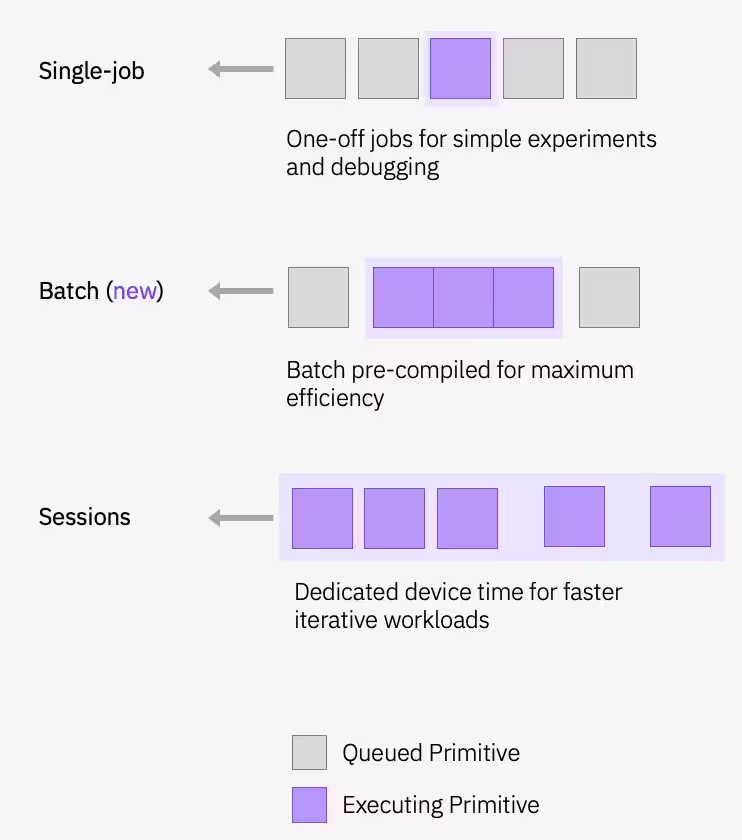
לולאת האופטימיזציה של QAOA רצה בתוך session של Quantum Compute כדי לשמור על ההתקן שמור לאורך האיטרציות. Estimator מעריך את בכל שלב, ואופטימייזר קלאסי (COBYLA) מעדכן את הפרמטרים עד להתכנסות.
 הגדר פרמטרים התחלתיים והרץ את לולאת האופטימיזציה:
# QAOA doesn't prescribe principled default angles — any bounded choice
# works as a warm start for problems this small. beta and gamma are
# periodic (beta in [0, pi] and gamma in [0, 2*pi] modulo the underlying
# Pauli-rotation periods), and pi/2 and pi are just midpoints of those
# ranges. For harder problems you would typically warm start from known
# good angles or transfer parameters from smaller instances.
initial_gamma = np.pi
initial_beta = np.pi / 2
init_params = [initial_beta, initial_beta, initial_gamma, initial_gamma]
def cost_func_estimator(params, ansatz, hamiltonian, estimator):
    # transform the observable defined on virtual qubits to
    # an observable defined on all physical qubits
    isa_hamiltonian = hamiltonian.apply_layout(ansatz.layout)

    pub = (ansatz, isa_hamiltonian, params)
    job = estimator.run([pub])

    results = job.result()[0]
    cost = results.data.evs

    objective_func_vals.append(cost)

    return cost
objective_func_vals = []  # Global variable
with Session(backend=backend) as session:
    # If using qiskit-ibm-runtime<0.24.0, change `mode=` to `session=`
    estimator = Estimator(mode=session)
    estimator.options.default_shots = 1000

    # Set simple error suppression/mitigation options
    estimator.options.dynamical_decoupling.enable = True
    estimator.options.dynamical_decoupling.sequence_type = "XY4"
    estimator.options.twirling.enable_gates = True
    estimator.options.twirling.num_randomizations = "auto"
    estimator.options.environment.job_tags = ["TUT_QAOA"]

    result = minimize(
        cost_func_estimator,
        init_params,
        args=(candidate_circuit, cost_hamiltonian, estimator),
        method="COBYLA",
        tol=1e-2,
    )
    print(result)
message: Return from COBYLA because the trust region radius reaches its lower bound.
 success: True
  status: 0
     fun: -2.0402211719947774
       x: [ 3.041e+00  1.212e+00  2.081e+00  4.471e+00]
    nfev: 36
   maxcv: 0.0
האופטימייזר הצליח להפחית את העלות ולמצוא פרמטרים טובים יותר עבור ה-Circuit.
עקומה שיורדת בצורה חלקה ומתייצבת היא סימן ההיכר של התכנסות. עקומה רועשת ולא-מונוטונית מצביעה בדרך כלל על בעיה באחד השלבים הקודמים; הגורמים הנפוצים הם מעט מדי shots לכל הערכה (שונות גבוהה של ה-Estimator), פרמטרים התחלתיים גרועים, או Circuit שעומקו נשלט על ידי רעש חומרה. COBYLA אינו משתמש בנגזרות ועמיד למדי לרעש מתון, אך כאשר הרעש מציף את שיפורי העלות בפועל בכל צעד, מודל הקירוב הליניארי שלו כבר אינו יכול להבחין בין ירידה אמיתית לבין רעידות אקראיות, והאופטימייזר משוטט.
plt.figure(figsize=(12, 6))
plt.plot(objective_func_vals)
plt.xlabel("Iteration")
plt.ylabel("Cost")
plt.show()

הקצה את הפרמטרים המאופטמים ודגום את ההתפלגות הסופית באמצעות פרימיטיב ה-Sampler.
optimized_circuit = candidate_circuit.assign_parameters(result.x)
optimized_circuit.draw("mpl", fold=False, idle_wires=False)

# If using qiskit-ibm-runtime<0.24.0, change `mode=` to `backend=`
sampler = Sampler(mode=backend)
sampler.options.default_shots = 10000

# Set simple error suppression/mitigation options
sampler.options.dynamical_decoupling.enable = True
sampler.options.dynamical_decoupling.sequence_type = "XY4"
sampler.options.twirling.enable_gates = True
sampler.options.twirling.num_randomizations = "auto"

sampler.options.environment.job_tags = ["TUT_QAOA"]

pub = (optimized_circuit,)
job = sampler.run([pub], shots=int(1e4))
counts_int = job.result()[0].data.meas.get_int_counts()
counts_bin = job.result()[0].data.meas.get_counts()
shots = sum(counts_int.values())
final_distribution_int = {key: val / shots for key, val in counts_int.items()}
final_distribution_bin = {key: val / shots for key, val in counts_bin.items()}
print(final_distribution_int)
{18: 0.039, 5: 0.0665, 20: 0.0973, 29: 0.0063, 9: 0.0899, 13: 0.0379, 2: 0.0047, 1: 0.0153, 11: 0.0932, 14: 0.0327, 12: 0.0314, 25: 0.0193, 21: 0.0398, 6: 0.0224, 4: 0.0197, 10: 0.0387, 3: 0.0181, 26: 0.07, 17: 0.0327, 19: 0.0332, 22: 0.0914, 24: 0.007, 0: 0.0033, 8: 0.0066, 30: 0.0158, 28: 0.0169, 27: 0.0222, 16: 0.0073, 7: 0.0057, 23: 0.0062, 15: 0.0054, 31: 0.0041}
שלב 4: עיבוד התוצאות והחזרת תוצאה בפורמט קלאסי רצוי
חלץ את ה-bitstring הסביר ביותר מההתפלגות שנדגמה. זה מייצג את החיתוך הטוב ביותר שנמצא על ידי QAOA.
# auxiliary functions to sample most likely bitstring
def to_bitstring(integer, num_bits):
    result = np.binary_repr(integer, width=num_bits)
    return [int(digit) for digit in result]

keys = list(final_distribution_int.keys())
values = list(final_distribution_int.values())
most_likely = keys[np.argmax(np.abs(values))]
most_likely_bitstring = to_bitstring(most_likely, len(graph))
most_likely_bitstring.reverse()

print("Result bitstring:", most_likely_bitstring)
Result bitstring: [0, 0, 1, 0, 1]
plt.rcParams.update({"font.size": 10})
final_bits = final_distribution_bin
values = np.abs(list(final_bits.values()))
top_4_values = sorted(values, reverse=True)[:4]
positions = []
for value in top_4_values:
    positions.append(np.where(values == value)[0])
fig = plt.figure(figsize=(11, 6))
ax = fig.add_subplot(1, 1, 1)
plt.xticks(rotation=45)
plt.title("Result Distribution")
plt.xlabel("Bitstrings (reversed)")
plt.ylabel("Probability")
ax.bar(list(final_bits.keys()), list(final_bits.values()), color="tab:grey")
for p in positions:
    ax.get_children()[int(p[0])].set_color("tab:purple")
plt.show()

הצגה ויזואלית של החיתוך הטוב ביותר
מתוך ה-bitstring האופטימלי, תוכל לאחר מכן להציג ויזואלית את החיתוך הזה על הגרף המקורי.
# auxiliary function to plot graphs
def plot_result(G, x):
    colors = ["tab:grey" if i == 0 else "tab:purple" for i in x]
    pos, _default_axes = rx.spring_layout(G), plt.axes(frameon=True)
    rx.visualization.mpl_draw(
        G, node_color=colors, node_size=100, alpha=0.8, pos=pos
    )

plot_result(graph, most_likely_bitstring)

כעת, חשב את ערך החיתוך:
def evaluate_sample(x: Sequence[int], graph: rx.PyGraph) -> float:
    assert len(x) == len(
        list(graph.nodes())
    ), "The length of x must coincide with the number of nodes in the graph."
    return sum(
        x[u] * (1 - x[v]) + x[v] * (1 - x[u])
        for u, v in list(graph.edge_list())
    )

cut_value = evaluate_sample(most_likely_bitstring, graph)
print("The value of the cut is:", cut_value)
The value of the cut is: 5
עבור גרף קטן כל כך, האופטימום האמיתי קל למציאה בכוח גס (brute-force), כך שתוכל לבדוק שוב את התוצאות על ידי השוואת תוצאת QAOA לתשובה המדויקת.
# Classical baseline: enumerate all 2**n_small bitstrings and take the best cut.
def brute_force_max_cut(graph: rx.PyGraph) -> tuple[int, list[int]]:
    n = len(list(graph.nodes()))
    best_cut = -1
    best_x: list[int] = []
    for i in range(2**n):
        x = [(i >> k) & 1 for k in range(n)]
        cut = evaluate_sample(x, graph)
        if cut > best_cut:
            best_cut = int(cut)
            best_x = x
    return best_cut, best_x

classical_best, classical_x = brute_force_max_cut(graph)
print(f"Classical optimum (brute force): {classical_best}")
print(f"QAOA cut value:                  {cut_value}")
Classical optimum (brute force): 5
QAOA cut value:                  5
דוגמה בקנה מידה גדול על חומרה
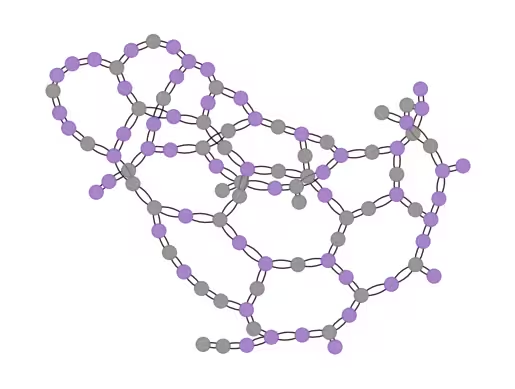
יש לך גישה להתקנים רבים עם יותר מ-100 qubits ב-IBM Quantum Platform. בחר אחד שעליו תפתור max-cut על גרף משוקלל בן 100 קודקודים. זוהי בעיה "בקנה מידה שימושי". זרימת העבודה עוקבת אחר אותם שלבים כמו לעיל, מיושמת על גרף גדול בהרבה.
זרימת עבודה מקצה לקצה בקנה מידה שימושי
כל ארבעת השלבים מוצגים להלן, מיושמים על הגרף בן 100 הקודקודים. המבנה זהה לסקירה בקנה המידה הקטן: מיפוי, טרנספילציה, ביצוע, עיבוד תוצאות — אך עם בעיה גדולה יותר ומפוצל לארבעת התאים שלהלן לשם הבהירות.
# Precomputed parity lookup table: _PARITY[b] = +1 if popcount(b) is even, else -1.
# We use this to vectorize expectation-value evaluation across all Pauli terms.
_PARITY = np.array(
    [-1 if bin(i).count("1") % 2 else 1 for i in range(256)],
    dtype=np.complex128,
)

def evaluate_sparse_pauli(state: int, observable: SparsePauliOp) -> complex:
    """Expectation value of a SparsePauliOp on a single computational-basis state.

    For a Z-only observable (which QAOA cost Hamiltonians are, after the
    QUBO-to-Hamiltonian mapping), the eigenvalue of each Pauli term on a
    computational-basis state is simply (-1)**popcount(z_mask AND state),
    i.e., the parity of the bitwise-AND of the term's Z-support and the
    measured bitstring.

    This routine packs the Z-support of every Pauli term into bytes, ANDs
    them against the measured state in a single vectorized op, and looks up
    the parity in _PARITY. For a 100-qubit / ~hundreds-of-terms Hamiltonian
    over 10_000 samples, this is dramatically faster than calling
    SparsePauliOp.expectation_value per sample.
    """
    packed_uint8 = np.packbits(observable.paulis.z, axis=1, bitorder="little")
    state_bytes = np.frombuffer(
        state.to_bytes(packed_uint8.shape[1], "little"), dtype=np.uint8
    )
    reduced = np.bitwise_xor.reduce(packed_uint8 & state_bytes, axis=1)
    return np.sum(observable.coeffs * _PARITY[reduced])

def best_solution(samples, hamiltonian):
    """Return the sampled bitstring (as int) with the lowest Hamiltonian cost."""
    min_cost = float("inf")
    min_sol = None
    for bit_str in samples.keys():
        candidate_sol = int(bit_str)
        fval = evaluate_sparse_pauli(candidate_sol, hamiltonian).real
        if fval <= min_cost:
            min_cost = fval
            min_sol = candidate_sol
    return min_sol

def _plot_cdf(objective_values: dict, ax, color):
    x_vals = sorted(objective_values.keys(), reverse=True)
    y_vals = np.cumsum([objective_values[x] for x in x_vals])
    ax.plot(x_vals, y_vals, color=color)

def plot_cdf(dist, ax, title):
    _plot_cdf(dist, ax, "C1")
    ax.vlines(min(list(dist.keys())), 0, 1, "C1", linestyle="--")
    ax.set_title(title)
    ax.set_xlabel("Objective function value")
    ax.set_ylabel("Cumulative distribution function")
    ax.grid(alpha=0.3)

def samples_to_objective_values(samples, hamiltonian):
    """Convert the samples to values of the objective function."""
    objective_values = defaultdict(float)
    for bit_str, prob in samples.items():
        candidate_sol = int(bit_str)
        fval = evaluate_sparse_pauli(candidate_sol, hamiltonian).real
        objective_values[fval] += prob
    return objective_values
שלב 1: בנה את הגרף, המילטוניאן העלות וה-ansatz.
# Step 1: build the 100-node graph, cost Hamiltonian, and QAOA ansatz.
n_large = 100
graph_100 = rx.PyGraph()
graph_100.add_nodes_from(np.arange(0, n_large, 1))
elist = []
for edge in backend.coupling_map:
    if edge[0] < n_large and edge[1] < n_large:
        elist.append((edge[0], edge[1], 1.0))
graph_100.add_edges_from(elist)

max_cut_paulis_100 = build_max_cut_paulis(graph_100)
cost_hamiltonian_100 = SparsePauliOp.from_sparse_list(
    max_cut_paulis_100, n_large
)

circuit_100 = QAOAAnsatz(cost_operator=cost_hamiltonian_100, reps=1)
circuit_100.measure_all()
שלב 2: בצע Transpile עבור ה-Backend החומרתי שנבחר.
# Step 2: transpile for hardware.
pm = generate_preset_pass_manager(optimization_level=3, backend=backend)
candidate_circuit_100 = pm.run(circuit_100)
שלב 3: הרץ את לולאת האופטימיזציה של QAOA בתוך session, ולאחר מכן דגום.
# Step 3: run the QAOA optimization loop on the device, then sample the
# final distribution with the optimized parameters.
initial_gamma = np.pi
initial_beta = np.pi / 2
init_params = [initial_beta, initial_gamma]

objective_func_vals = []  # Global variable
with Session(backend=backend) as session:
    estimator = Estimator(mode=session)
    estimator.options.default_shots = 1000

    # Set simple error suppression/mitigation options
    estimator.options.dynamical_decoupling.enable = True
    estimator.options.dynamical_decoupling.sequence_type = "XY4"
    estimator.options.twirling.enable_gates = True
    estimator.options.twirling.num_randomizations = "auto"
    estimator.options.environment.job_tags = ["TUT_QAOA"]

    result = minimize(
        cost_func_estimator,
        init_params,
        args=(candidate_circuit_100, cost_hamiltonian_100, estimator),
        method="COBYLA",
    )
    print(result)

# Assign optimal parameters and sample the final distribution.
optimized_circuit_100 = candidate_circuit_100.assign_parameters(result.x)

sampler = Sampler(mode=backend)
sampler.options.default_shots = 10000

# Set simple error suppression/mitigation options
sampler.options.dynamical_decoupling.enable = True
sampler.options.dynamical_decoupling.sequence_type = "XY4"
sampler.options.twirling.enable_gates = True
sampler.options.twirling.num_randomizations = "auto"

# Add a unique tag to the job execution
sampler.options.environment.job_tags = ["TUT_QAOA"]

pub = (optimized_circuit_100,)
job = sampler.run([pub], shots=int(1e4))

counts_int = job.result()[0].data.meas.get_int_counts()
shots = sum(counts_int.values())
final_distribution_100_int = {
    key: val / shots for key, val in counts_int.items()
}
message: Return from COBYLA because the trust region radius reaches its lower bound.
 success: True
  status: 0
     fun: -17.172689238986344
       x: [ 2.574e+00  4.166e+00]
    nfev: 28
   maxcv: 0.0
שלב 4: עבד את ההתפלגות שנדגמה כדי לחלץ את החיתוך הטוב ביותר.
# Step 4: find the best-cost sample and evaluate its cut value.
best_sol_100 = best_solution(final_distribution_100_int, cost_hamiltonian_100)
best_sol_bitstring_100 = to_bitstring(int(best_sol_100), len(graph_100))
best_sol_bitstring_100.reverse()

print("Result bitstring:", best_sol_bitstring_100)

cut_value_100 = evaluate_sample(best_sol_bitstring_100, graph_100)
print("The value of the cut is:", cut_value_100)
Result bitstring: [1, 1, 0, 1, 1, 0, 1, 1, 1, 0, 1, 0, 1, 1, 1, 0, 1, 1, 1, 1, 0, 0, 1, 0, 0, 1, 1, 0, 1, 0, 1, 0, 1, 1, 0, 1, 1, 0, 0, 0, 0, 0, 1, 1, 0, 1, 0, 0, 0, 1, 0, 0, 1, 0, 1, 0, 0, 1, 1, 1, 1, 1, 0, 1, 0, 1, 0, 0, 0, 1, 0, 1, 0, 1, 0, 0, 0, 0, 1, 0, 0, 1, 0, 1, 1, 1, 1, 0, 1, 0, 1, 0, 1, 1, 1, 0, 1, 1, 1, 0]
The value of the cut is: 156
ודא שהעלות שמוזערה בלולאת האופטימיזציה התכנסה, והצג ויזואלית את התוצאות.
# Plot convergence
plt.figure(figsize=(12, 6))
plt.plot(objective_func_vals)
plt.xlabel("Iteration")
plt.ylabel("Cost")
plt.show()

# Visualize the cut
plot_result(graph_100, best_sol_bitstring_100)

# Plot cumulative distribution function
result_dist = samples_to_objective_values(
    final_distribution_100_int, cost_hamiltonian_100
)
fig, ax = plt.subplots(1, 1, figsize=(8, 6))
plot_cdf(result_dist, ax, backend.name)


צעדים הבאים
אם מצאת את העבודה הזו מעניינת, ייתכן שתתעניין בחומר הבא:
- טכניקות מתקדמות עבור QAOA — בוחן אסטרטגיות מתקדמות לשיפור ביצועי QAOA
- אתגר אופטימיזציה רב-מטרתית — העמד את כישוריך במבחן עם אתגר הקהילה הזה באופטימיזציה קוונטית רב-מטרתית
- תיעוד טרנספילציה לכוונון עדין של אופטימיזציית מעגלים
- דיכוי והפחתת שגיאות לשיפור תוצאות החומרה